Quarto enables you to weave together content and executable code into a finished document. To learn more about Quarto see https://quarto.org.
Running Code
When you click the Render button a document will be generated that includes both content and the output of embedded code. You can embed code like this:
'data.frame':   13580 obs. of  22 variables:
 $ X            : int  1 2 3 4 5 6 7 8 9 10 ...
 $ Suburb       : chr  "Abbotsford" "Abbotsford" "Abbotsford" "Abbotsford" ...
 $ Address      : chr  "85 Turner St" "25 Bloomburg St" "5 Charles St" "40 Federation La" ...
 $ Rooms        : int  2 2 3 3 4 2 3 2 1 2 ...
 $ Type         : chr  "h" "h" "h" "h" ...
 $ Price        : num  1480000 1035000 1465000 850000 1600000 ...
 $ Method       : chr  "S" "S" "SP" "PI" ...
 $ SellerG      : chr  "Biggin" "Biggin" "Biggin" "Biggin" ...
 $ Date         : chr  "2016-12-03" "2016-02-04" "2017-03-04" "2017-03-04" ...
 $ Distance     : num  2.5 2.5 2.5 2.5 2.5 2.5 2.5 2.5 2.5 2.5 ...
 $ Postcode     : int  3067 3067 3067 3067 3067 3067 3067 3067 3067 3067 ...
 $ Bedroom2     : int  2 2 3 3 3 2 4 2 1 3 ...
 $ Bathroom     : int  1 1 2 2 1 1 2 1 1 1 ...
 $ Car          : int  1 0 0 1 2 0 0 2 1 2 ...
 $ Landsize     : int  202 156 134 94 120 181 245 256 0 220 ...
 $ BuildingArea : num  NA 79 150 NA 142 NA 210 107 NA 75 ...
 $ YearBuilt    : int  NA 1900 1900 NA 2014 NA 1910 1890 NA 1900 ...
 $ CouncilArea  : chr  "Yarra" "Yarra" "Yarra" "Yarra" ...
 $ Lattitude    : num  -37.8 -37.8 -37.8 -37.8 -37.8 ...
 $ Longtitude   : num  145 145 145 145 145 ...
 $ Regionname   : chr  "Northern Metropolitan" "Northern Metropolitan" "Northern Metropolitan" "Northern Metropolitan" ...
 $ Propertycount: int  4019 4019 4019 4019 4019 4019 4019 4019 4019 4019 ...
summary(melbh)
       X            Suburb            Address              Rooms
 Min.   :    1   Length:13580       Length:13580       Min.   : 1.000
 1st Qu.: 3396   Class :character   Class :character   1st Qu.: 2.000
 Median : 6790   Mode  :character   Mode  :character   Median : 3.000
 Mean   : 6790                                         Mean   : 2.938
 3rd Qu.:10185                                         3rd Qu.: 3.000
 Max.   :13580                                         Max.   :10.000

     Type               Price            Method            SellerG
 Length:13580       Min.   :  85000   Length:13580       Length:13580
 Class :character   1st Qu.: 650000   Class :character   Class :character
 Mode  :character   Median : 903000   Mode  :character   Mode  :character
                    Mean   :1075684
                    3rd Qu.:1330000
                    Max.   :9000000

     Date              Distance        Postcode       Bedroom2
 Length:13580       Min.   : 0.00   Min.   :3000   Min.   : 0.000
 Class :character   1st Qu.: 6.10   1st Qu.:3044   1st Qu.: 2.000
 Mode  :character   Median : 9.20   Median :3084   Median : 3.000
                    Mean   :10.14   Mean   :3105   Mean   : 2.915
                    3rd Qu.:13.00   3rd Qu.:3148   3rd Qu.: 3.000
                    Max.   :48.10   Max.   :3977   Max.   :20.000

    Bathroom          Car           Landsize         BuildingArea
 Min.   :0.000   Min.   : 0.00   Min.   :     0.0   Min.   :    0
 1st Qu.:1.000   1st Qu.: 1.00   1st Qu.:   177.0   1st Qu.:   93
 Median :1.000   Median : 2.00   Median :   440.0   Median :  126
 Mean   :1.534   Mean   : 1.61   Mean   :   558.4   Mean   :  152
 3rd Qu.:2.000   3rd Qu.: 2.00   3rd Qu.:   651.0   3rd Qu.:  174
 Max.   :8.000   Max.   :10.00   Max.   :433014.0   Max.   :44515
                 NA's   :62                         NA's   :6450
   YearBuilt    CouncilArea          Lattitude        Longtitude
 Min.   :1196   Length:13580       Min.   :-38.18   Min.   :144.4
 1st Qu.:1940   Class :character   1st Qu.:-37.86   1st Qu.:144.9
 Median :1970   Mode  :character   Median :-37.80   Median :145.0
 Mean   :1965                      Mean   :-37.81   Mean   :145.0
 3rd Qu.:1999                      3rd Qu.:-37.76   3rd Qu.:145.1
 Max.   :2018                      Max.   :-37.41   Max.   :145.5
 NA's   :5375
  Regionname        Propertycount
 Length:13580       Min.   :  249
 Class :character   1st Qu.: 4380
 Mode  :character   Median : 6555
                    Mean   : 7454
                    3rd Qu.:10331
                    Max.   :21650
library(dplyr)
Attaching package: 'dplyr'
The following objects are masked from 'package:stats':

    filter, lag
The following objects are masked from 'package:base':

    intersect, setdiff, setequal, union
###Removing NA from the data melb2 <- melbh[complete.cases(melbh),]melbPRA <-select(melb2, Price,Rooms,age=YearBuilt)
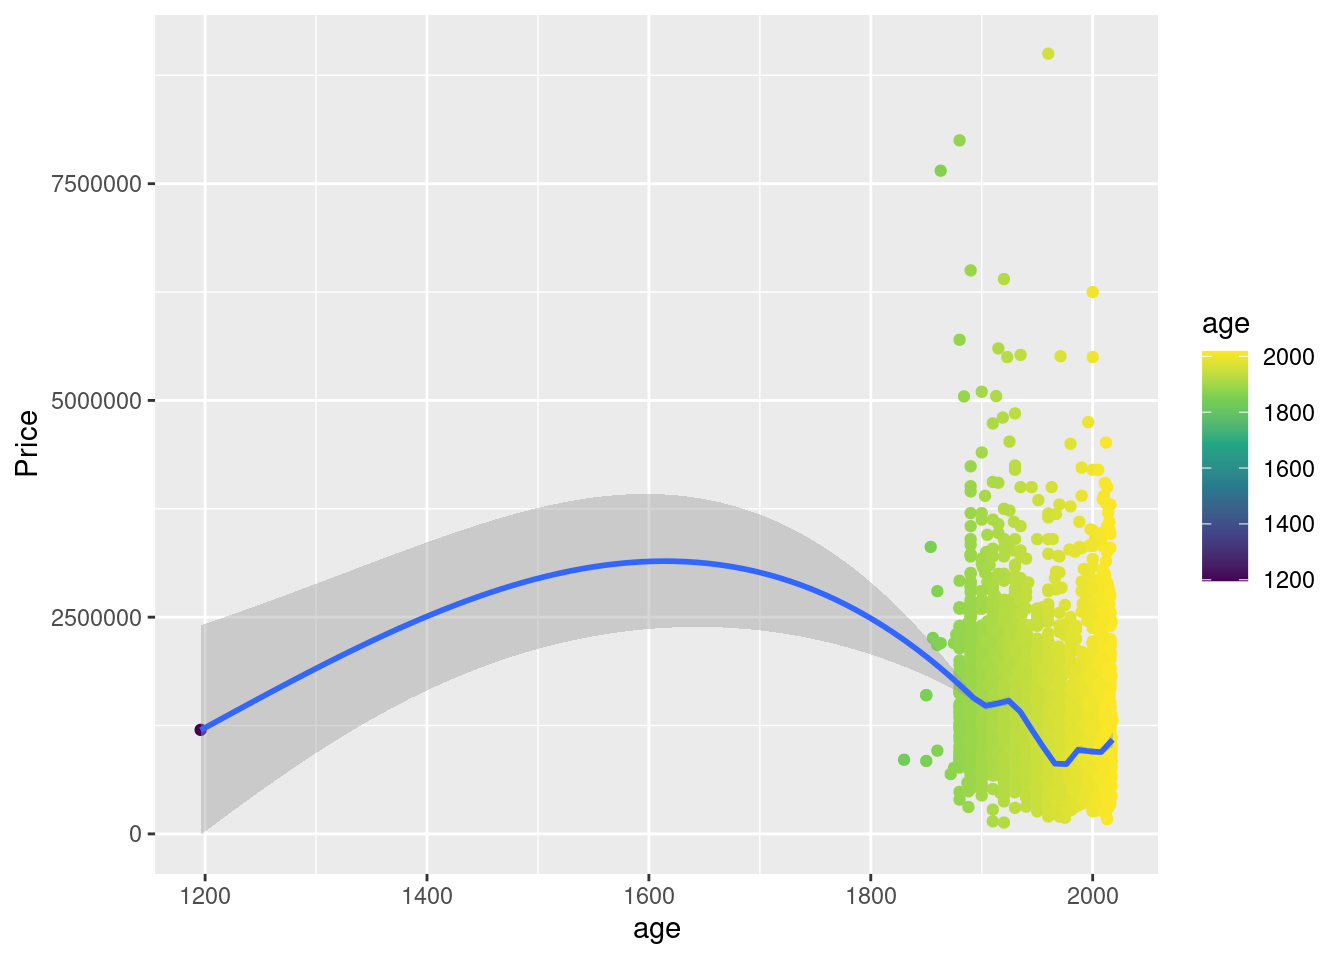
`geom_smooth()` using method = 'gam' and formula = 'y ~ s(x, bs = "cs")'
Warning: The following aesthetics were dropped during statistical transformation:
colour.
ℹ This can happen when ggplot fails to infer the correct grouping structure in
  the data.
ℹ Did you forget to specify a `group` aesthetic or to convert a numerical
  variable into a factor?
melbPRA <- melbPRA %>%filter(age>1800)
The echo: false option disables the printing of code (only output is displayed).